
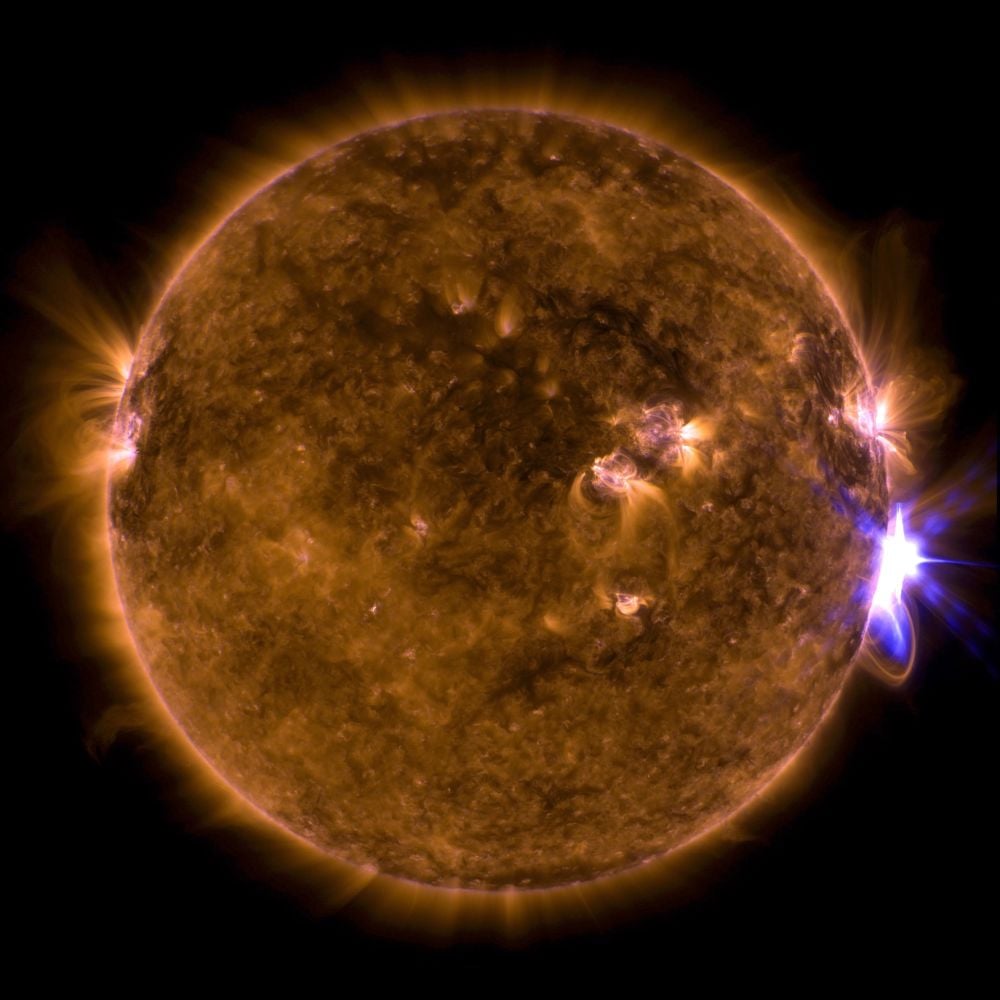
Many topics in astronomy and astrophysics are esoteric. There’s not much of a relationship between something like the supermassive black hole at the center of the Milky Way and the life of a regular person going about their business. But the Sun is different. Its presence in our lives is inescapable. Its behaviour, especially its flaring, has an impact.
Solar flaring makes itself known on Earth when their accompanying coronal mass ejections (CME) strike Earth and create mesmerizing aurorae. But they can be more than beautiful manifestations of light and magnetic fields. They can pack a punch, especially when they’re really powerful.
Astrophysicists classify solar flares by their X-ray brightness. From least energetic to most energetic they’re placed in categories A, B, C, M, and X. Each letter indicates a ten-fold increase in energy output.
A solar flare is actually a kind of explosion, and they’re the most powerful explosions in the Solar System. They release an enormous amount of energy, equivalent to the simultaneous detonation of millions or even billions of hydrogen bombs. They dwarf supervolcano eruptions on Earth, and even the huge asteroid that ended the dinosaurs.
They’re caused by the Sun’s powerful magnetic fields, which are constantly twisted and rotated. Their specific trigger is reconnection, when the magnetic fields can no longer put up with the twisting and rotating and finally snap. They reconnect into a more straightforward and stable configuration. When that happens, some of the Sun’s energy is released from its magnetic restraints and emitted as a solar flare.
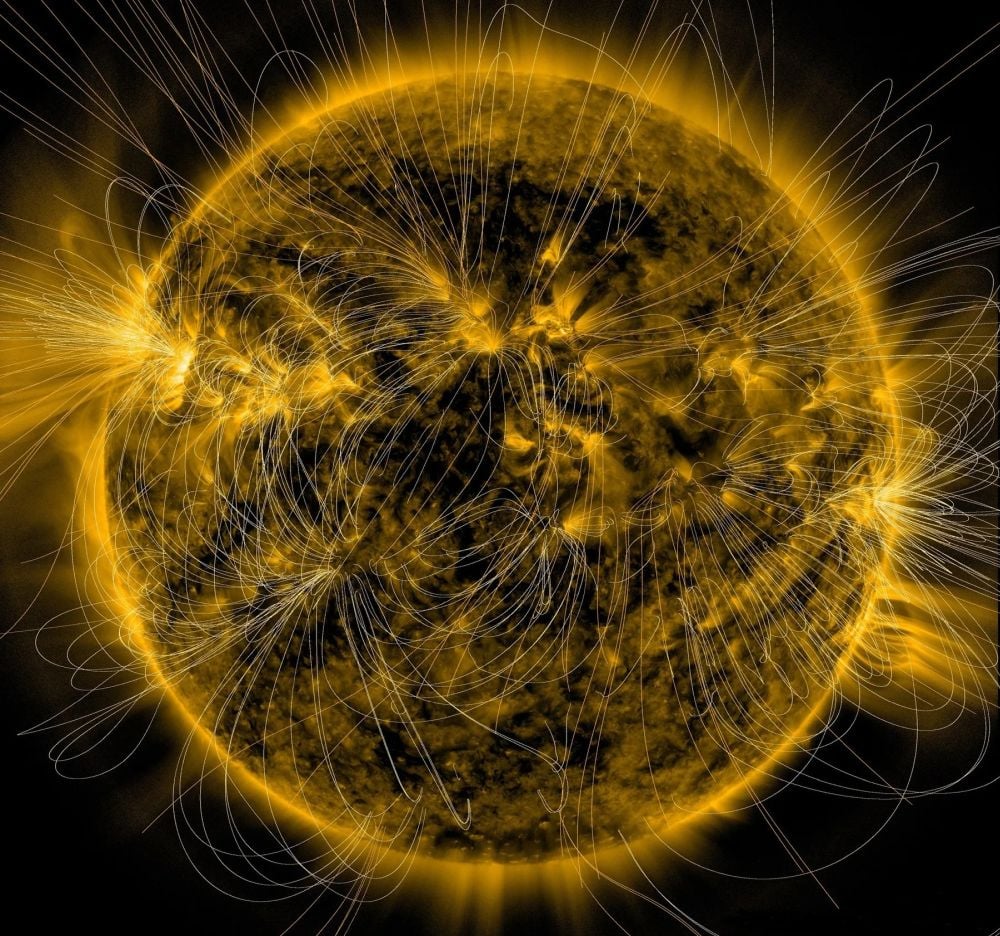 This is a depiction of the Sun’s magnetic fields overlaid on an image of the Sun captured in extreme ultraviolet light by NASA’s Solar Dynamics Observatory on March 12, 2016. The churning, rotating fields eventually break, and then reconnect to the Sun in a more stable and straightforward configuration, releasing flares. Image Credit: NASA/SDO/AIA/LMSAL
Solar flares can cause radio blackouts when they strike the ionosphere, disrupting aviation and maritime communications. They can introduce inaccuracies in GPS systems by altering the altitude of satellites. They can sometimes create malfunctions in electronics on spacecraft. Their accompanying CMEs can also disrupt our power grids.
There’s an ongoing effort to understand solar flares, and research published in The Astrophysical Journal is part of the effort. It’s titled “Evolution of Spatial Complexity in Flare Ribbon Substructure and Its Relationship to Magnetic Reconnection Dynamics.” The lead author is Marcel Corchado Albelo from the U.S. National Science Foundation and an ambassador for the Daniel K. Inouye Solar Telescope.
“It’s a beautiful example of theory, observation, and collaboration coming together…” – Maria Kazachenko, co-author, National Solar Observatory.
Flares originate in the Sun’s outermost layer, the corona, which is hidden by the Sun’s glare, and they’re difficult to observe there. But in this research, the authors focused on flare ribbons. These are kind of like a flare’s footprints, made of plasma and high-energy particles that slam back into the Sun during reconnection. They follow magnetic field lines, and when they collide with the Sun’s chromosphere, they light up brilliantly.
“Recent three-dimensional flare models suggest that flare ribbon substructure is linked to the fragmentation of the reconnecting current sheet in the corona,” the authors write. “Flare ribbon substructure can therefore potentially serve as a unique diagnostic tool for physical processes in the flare current sheet.”
The researchers figured out how to quantify the evolution of these flare ribbons and their substructure by looking at small details of the flare ribbons where they deposit their energy in the chromosphere. These details provided clues to what’s happening far above.
They created a model and tested it against synthetic observations. Then they applied it to a real flare. “We then apply it to an M6.5-class solar flare on 2015 June 22 observed by the Interface Region Imaging Spectrograph (IRIS),” the authors write. IRIS is a solar observation satellite launched in 2013.
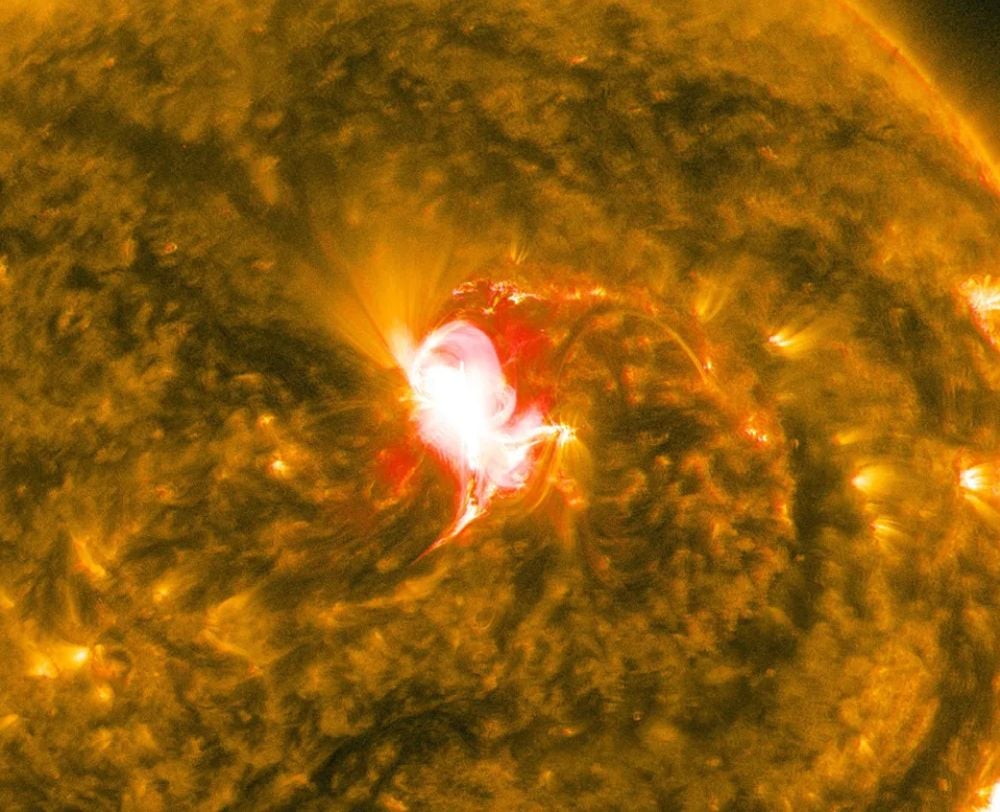 This is the mid-level flare referred to in the research. This image is from the Solar Dynamics Observatory, not IRIS. Image Credit: NASA/SDO
They found that when the flares deposit their energy, it’s not a smooth or uniform process. Instead of one big energetic event, the flare ribbon breaks apart into different sized fragments and deposits its energy in bursts.
“For the first time we have experimentally shown a physical relationship between the irregular shapes we observe, and the structure of the energy conversion region,” lead author Corchado Albelo said in a press release.
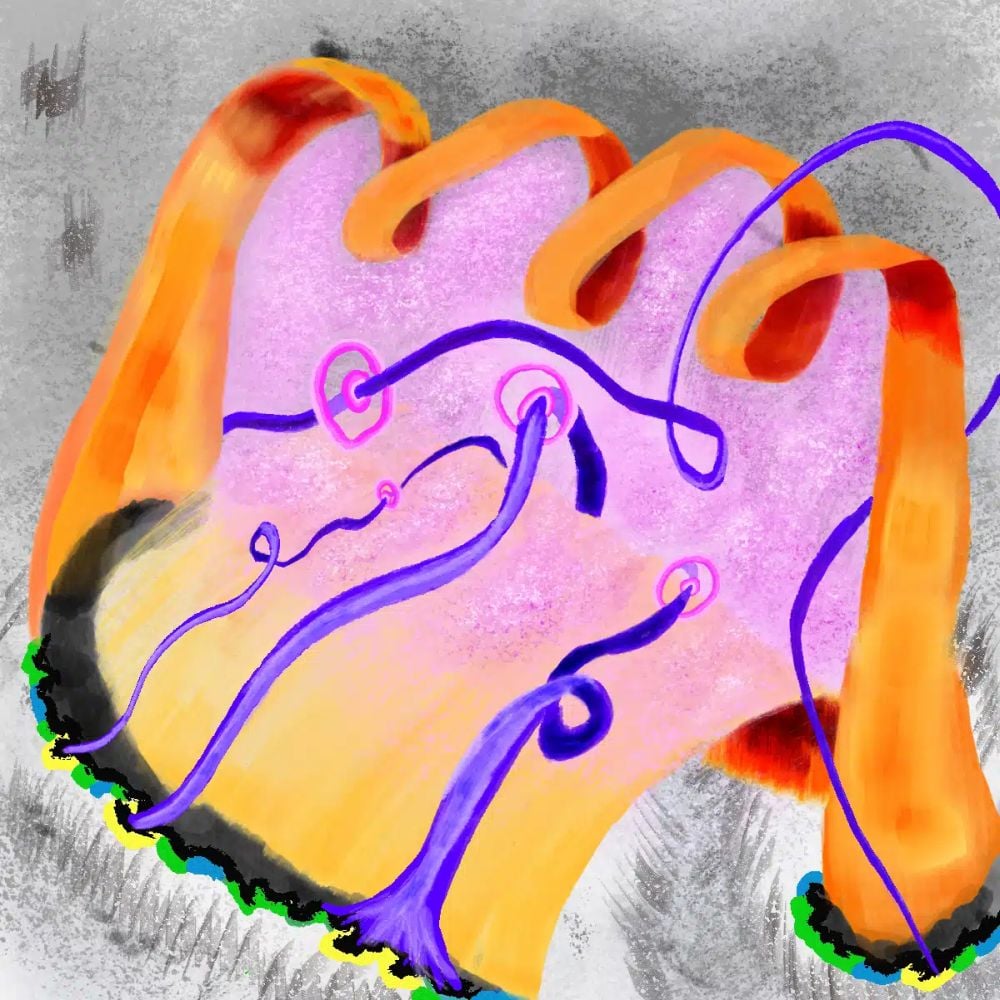 This illustration helps explain the findings. The structure of the black boundary (dark gray–flare energy deposition site) is connected to a multi layer reconnection site (magenta–energy conversion site). Specifically, the smallest details (black–irregular shapes) suggest the inner region can be broken up into additional regions (darker magenta blobs), connected by special magnetic fields (purple). The mustard yellow region highlights the relaxed magnetic loops (post reconnected). The orange region highlights the erupting flux rope—i.e., a Coronal Mass Ejection (CME). Image Credit: Artistic Rendition by Corchado Albelo.
“For years, simulations have suggested that flare ribbon boundaries should behave a particular way,” said Maria Kazachenko, study co-author and National Solar Observatory scientist. Up until now, there’s been no way to confirm it with observations. “In this work, for the first time, we provided a quantitative observational test of those simulations. By applying a novel tool, adapted from a completely different field, Corchado Albelo was able to show that ribbon complexity increased with reconnection rate.”
“It’s a beautiful example of theory, observation, and collaboration coming together, driven by the persistence and creativity of a graduate student,” added Kazachenko, who also advises Corchado Albelo’s graduate work.
The basic idea is that visible patterns below offer clues to difficult to observe processes above. “We can diagnose what’s happening in the energy conversion region by studying the irregularities of these shapes,” Corchado Albelo said.
“We conclude that the buildup of the spatial complexity of the ribbons at multiple spatial scales can serve as an observational proxy for current-sheet fragmentation in the corona,” the authors write.
This work won’t help forecast flaring on its own. But it makes a contribution to the overall understanding of flares. It helps explain how flares release their energy, and will inform better models of flaring.
“Altogether, our analysis is a first step toward quantitative linking of flare ribbon morphology to reconnection dynamics,” the authors conclude.